Break-Even ROAS: What It Actually Is, How to Calculate It, and Why Most Advertisers Get It Wrong
I've been running paid ads for ecommerce brands for years now, and there's one conversation that keeps coming up. A brand owner walks in, shows me their ad dashboard, and says something like — "We're getting a 3x ROAS. Is that good?"
And my answer is always the same: it depends.
A 3x ROAS could mean you're swimming in profit. Or it could mean you're quietly bleeding money on every single sale. Without knowing one specific number, you simply cannot tell the difference.
That number is your break-even ROAS.
I've seen brands pause campaigns that were making them money because "3x didn't feel like enough." I've also seen brands dump thousands into campaigns that were actually unprofitable, all because they assumed a decent-looking ROAS meant they were in the clear.
Both of those mistakes come from the same place — not knowing where the break-even line actually sits.
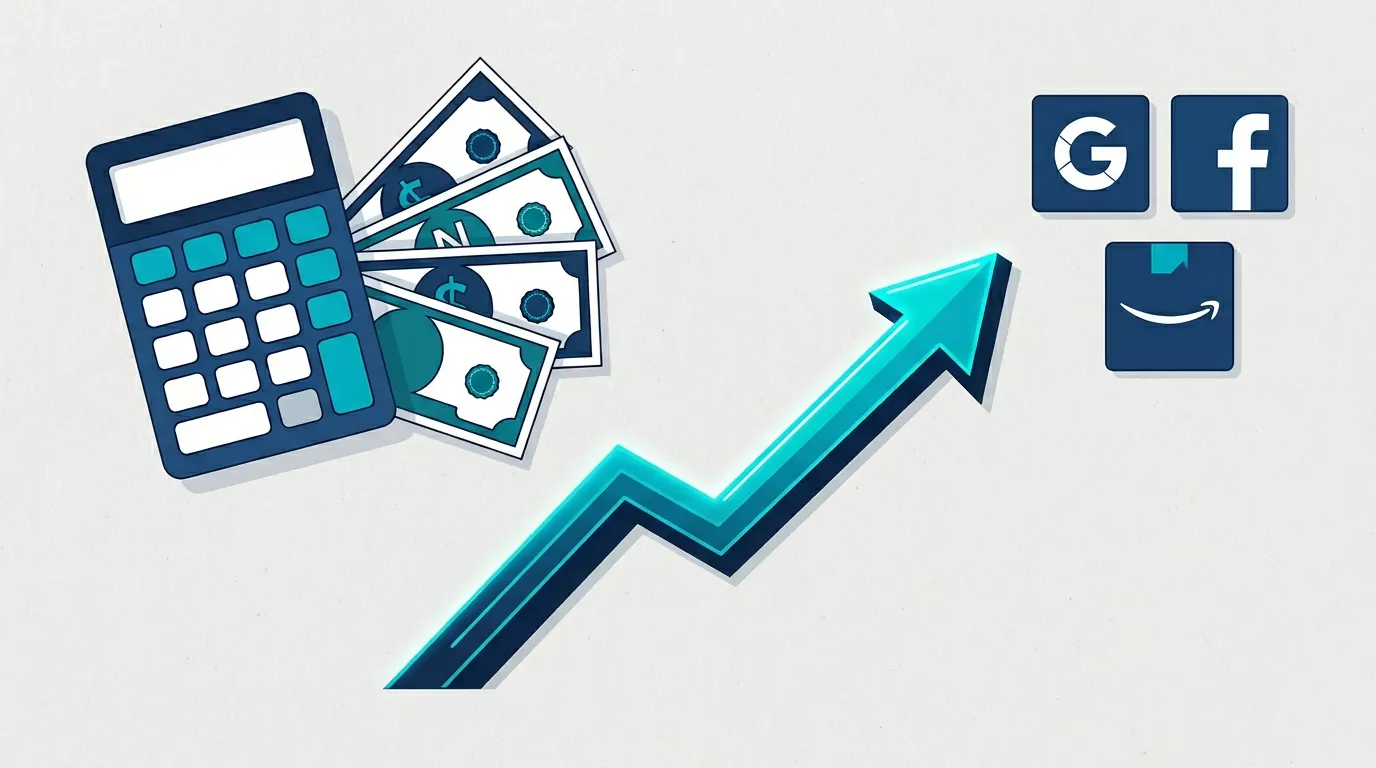
In this guide, I'm going to walk you through everything you need to know about break-even ROAS. What it actually means. How to calculate it properly (most guides skip the important costs). How it works differently across Google, Facebook, TikTok, and Amazon. And how to use our free Break-Even ROAS Calculator to find your number in about 30 seconds.
Let's get into it.
📑 What's in This Guide
- What Break-Even ROAS Actually Means
- Break-Even ROAS vs Target ROAS
- The Break-Even ROAS Formula
- Real-World Calculation Example
- Why This Number Matters More Than You Think
- Break-Even ROAS by Ad Platform
- Industry ROAS Benchmarks (2026)
- 8 Ways to Lower Your Break-Even ROAS
- Mistakes That Cost Advertisers Thousands
- Frequently Asked Questions
What Break-Even ROAS Actually Means
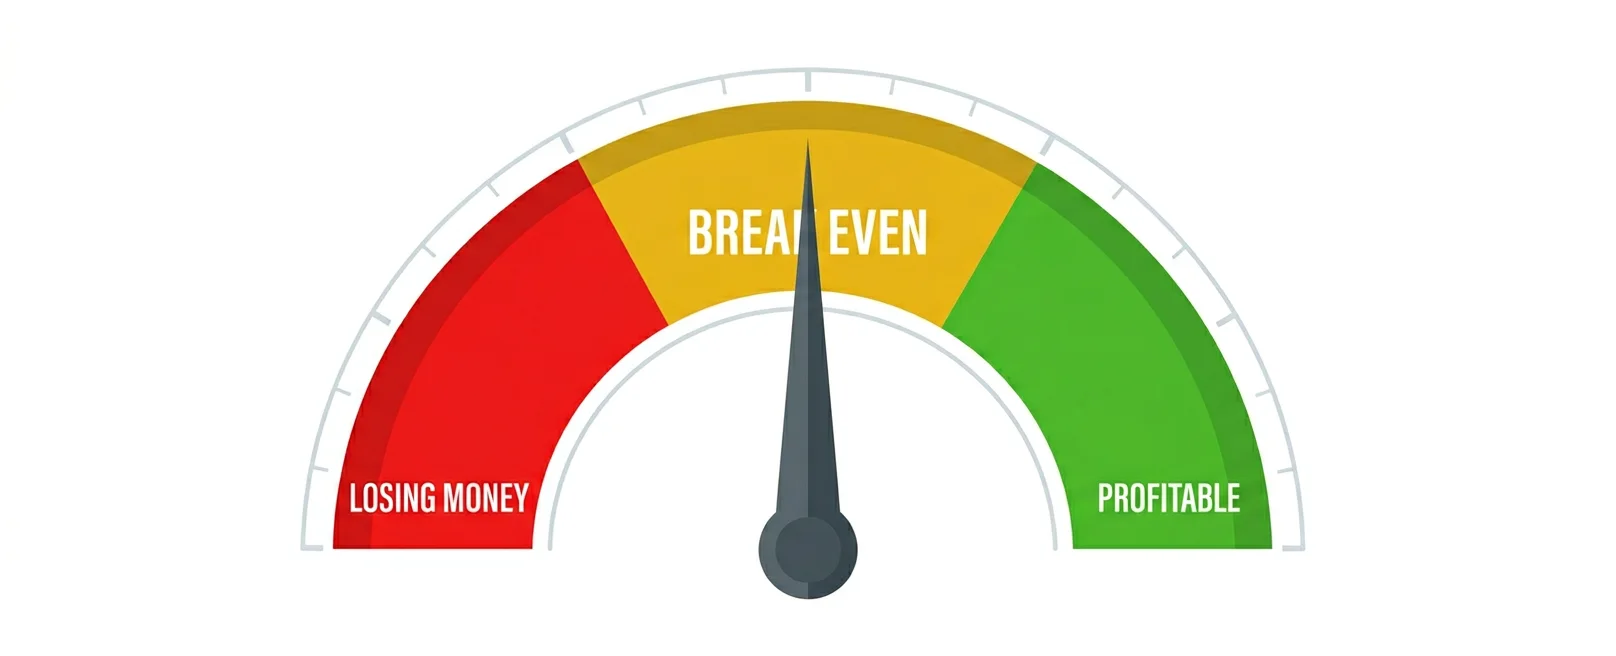
Break-even ROAS is the minimum revenue your ad campaign needs to bring in for every dollar you spend on ads — just to cover your costs. Not to make a profit. Just to not lose money.
Let me put it in plain English with a quick scenario.
Say you sell a product for $50. After you account for the product cost, shipping, payment processing, and all that other stuff — you're left with $20 in gross profit per order. That means your profit margin is 40%.
Now, if you spend $1 on ads, you need to bring in at least $2.50 in revenue to cover that $1 in ad cost plus all your other expenses. That $2.50 is your break-even ROAS — specifically, 2.5x.
Here's what that means in practice:
- Your campaign hits 3.5x ROAS → You're making money. Keep going.
- Your campaign hits 2.5x ROAS → You're exactly breaking even. No profit, no loss.
- Your campaign hits 1.8x ROAS → You're losing money on every ad-driven sale.
💡 Key Takeaway
Break-even ROAS isn't about what "looks good" or what the industry average is. It's the hard mathematical line between making money and burning it. And it's different for every single product you sell.
Break-Even ROAS vs Target ROAS — They're Not the Same Thing
This is where a lot of people get confused, so let me clear it up.
| Break-Even ROAS | Target ROAS | |
|---|---|---|
| What it is | The minimum ROAS to avoid losing money | The ROAS you aim for to make a profit |
| Think of it as | The floor — don't go below this | The goal — this is where you want to be |
| How you find it | Calculated from your actual costs | Set by you, based on break-even + desired profit |
| Example | 2.5x — anything below this and you lose money | 4.0x — this gives you a healthy profit margin |
Your target ROAS should always be higher than your break-even ROAS. The gap between them? That's your actual advertising profit.
A practical rule I've found works well: set your target ROAS at roughly 1.5x to 2x your break-even number. If your break-even is 2.5x, aim for somewhere between 3.75x and 5x as your campaign target. That gives you a comfortable profit buffer while still being realistic.
The Break-Even ROAS Formula
The formula itself is surprisingly simple. The tricky part — the part most guides gloss over — is calculating your real profit margin first.
The Basic Formula
Break-Even ROAS Formula
Break-Even ROAS = 1 ÷ Profit Margin
Where profit margin is expressed as a decimal (e.g., 40% = 0.40)
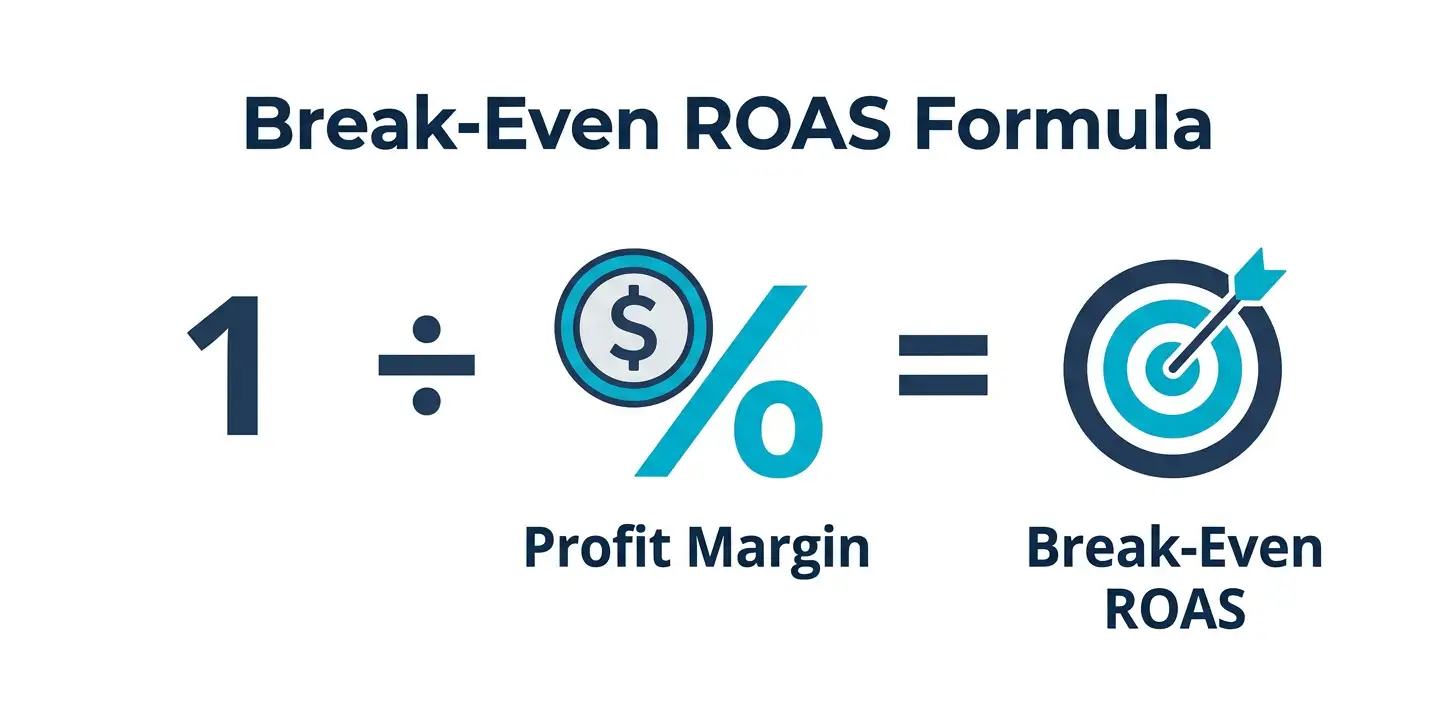
That's the whole thing. One divided by your profit margin. But the margin part is where people mess up, because they forget half their costs.
Here's a quick reference so you can see the relationship:
| Profit Margin | Calculation | Break-Even ROAS | What It Means |
|---|---|---|---|
| 20% | 1 ÷ 0.20 | 5.0x | Tough — need $5 revenue per $1 ad spend |
| 30% | 1 ÷ 0.30 | 3.33x | Challenging but doable |
| 40% | 1 ÷ 0.40 | 2.50x | Solid — comfortable for most platforms |
| 50% | 1 ÷ 0.50 | 2.00x | Great — lots of room for profitable ads |
| 60% | 1 ÷ 0.60 | 1.67x | Excellent — easy to stay profitable |
| 70% | 1 ÷ 0.70 | 1.43x | Amazing — almost any campaign works |
See the pattern? Higher margins = lower break-even ROAS. This is exactly why high-margin products are so much easier to advertise profitably. A product with 60% margins only needs a measly 1.67x ROAS to break even, while a 20%-margin product needs a demanding 5.0x.
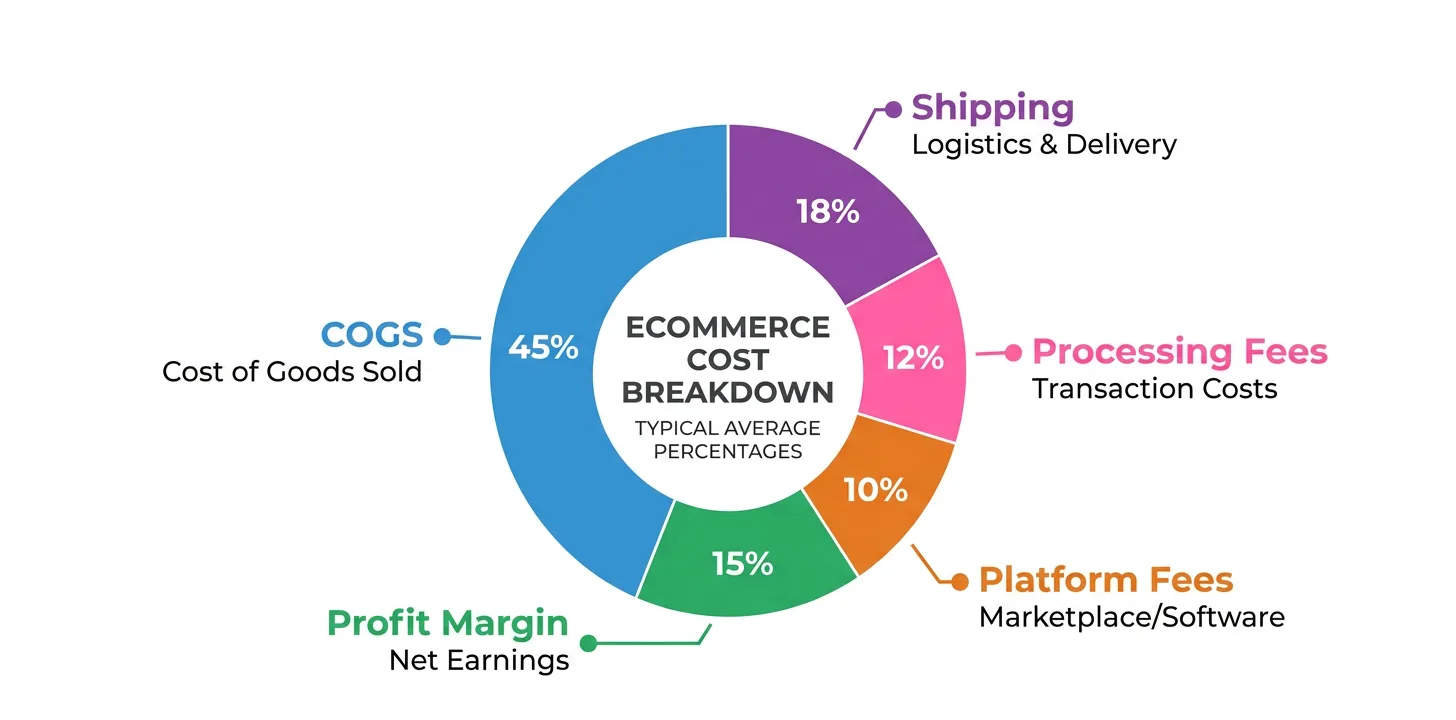
The Full Formula (With ALL Costs)
The basic formula works great if you already know your true margin. But here's the thing — most business owners underestimate their costs. They remember COGS, maybe shipping. But they forget about payment processing, returns, platform fees, and overhead.
Here's how to calculate your actual profit margin properly:
📝 Complete Profit Margin Calculation
Total Cost Per Order =
Cost of Goods Sold (COGS)
+ Shipping cost
+ Payment processing fee (usually 2.9% + $0.30)
+ Platform/marketplace fee (Amazon 15%, Etsy 6.5%, etc.)
+ Fulfillment fee (3PL, FBA, etc.)
+ Monthly overhead ÷ monthly orders
Profit Margin = (Selling Price − Total Cost) ÷ Selling Price
Break-Even ROAS = 1 ÷ Profit Margin
Don't feel like crunching all those numbers by hand? Fair enough. That's exactly why I built our Break-Even ROAS Calculator — just plug in your costs and it handles everything instantly, including charts and scenario analysis.
Let's Walk Through a Real Example
Theory is nice. Let's do the actual math with realistic numbers so you can see exactly how this works.
Meet Sarah — She Sells Skincare Products
Sarah runs a Shopify store selling a premium face serum. Here's her cost structure:
| Cost Item | Amount |
|---|---|
| Product Selling Price | $45.00 |
| Cost of Goods (COGS) | $12.00 |
| Shipping Cost | $5.50 |
| Stripe Processing Fee (2.9% + $0.30) | $1.61 |
| Average Discount Offered | 10% |
| Return Rate | 8% |
| Monthly Overhead (Shopify, apps, tools) | $3,000 |
| Average Monthly Orders | 600 |
Step 1: Calculate Effective Revenue
Sarah offers a 10% average discount across her campaigns, so her effective revenue isn't the full $45:
💰 Effective Revenue
$45.00 × (1 − 0.10) = $45.00 × 0.90 = $40.50
Step 2: Calculate All Costs Per Order
📊 Cost Breakdown
COGS: ........................ $12.00
Shipping: .................... $5.50
Stripe Fee (2.9% of $40.50 + $0.30): $1.47 + $0.30 = $1.77
Overhead ($3,000 ÷ 600 orders): ...... $5.00
────────────────────────────────
Total Cost Per Order: ........ $24.27
Shipping: .................... $5.50
Stripe Fee (2.9% of $40.50 + $0.30): $1.47 + $0.30 = $1.77
Overhead ($3,000 ÷ 600 orders): ...... $5.00
────────────────────────────────
Total Cost Per Order: ........ $24.27
Step 3: Find the Profit Margin
📈 Profit Margin
Gross Profit = $40.50 − $24.27 = $16.23
Profit Margin = $16.23 ÷ $40.50 = 40.07%
Profit Margin = $16.23 ÷ $40.50 = 40.07%
Step 4: Calculate Break-Even ROAS
🎯 Break-Even ROAS
Break-Even ROAS = 1 ÷ 0.4007 = 2.50x (250%)
Step 5: Adjust for Returns
Sarah has an 8% return rate, which eats into her profitable orders:
🔄 Adjusted for Returns
Adjusted Break-Even ROAS = 2.50 ÷ (1 − 0.08) = 2.50 ÷ 0.92 = 2.72x
Sarah's Final Numbers
| Metric | Value | What It Means |
|---|---|---|
| Break-Even ROAS | 2.72x | Need $2.72 revenue per $1 ad spend minimum |
| Break-Even CPA | $16.23 | Can spend up to $16.23 to acquire a customer |
| Profit Margin | 40.07% | Decent margin with room for profitable ads |
So if Sarah's Facebook ads are bringing in a 3.5x ROAS, she's in great shape — well above her 2.72x break-even. But if her TikTok campaigns are hovering around 2.0x, she's actually losing about $4-5 on every sale from that channel.
That kind of clarity changes how you make decisions. And it takes about 30 seconds with the right tool.
Calculate Your Break-Even ROAS in 30 Seconds
Plug in your product costs and get instant results with visual charts, scenario analysis, and platform-specific recommendations.
Open Free Calculator
100% Free
No Signup
PDF Export
Scenario Analysis
Why This Number Matters More Than You Think
I know what some of you are thinking — "It's just a number. I can eyeball whether my campaigns are working." Sure, you could also eyeball whether your car has enough fuel instead of looking at the gauge. But at some point, you'll run out on the highway.
Here's why break-even ROAS deserves more attention than most marketers give it:
It Stops You From Killing Winners
I've watched business owners pause campaigns doing 2.5x ROAS because some guru on YouTube told them "anything under 4x is bad." But their break-even was 1.8x. That "bad" campaign was generating a 39% return above break-even. They were literally throwing away profit because they didn't understand their own numbers.
It Stops You From Scaling Losers
On the flip side, I've seen brands pour money into a 3x ROAS campaign thinking they're crushing it. Then we dig into the numbers and discover their break-even is actually 3.4x because of high shipping costs and return rates they hadn't factored in. Every dollar they scaled was making the problem worse.
It Makes Bid Strategy Setup Dead Simple
Google Ads and Facebook both let you set target ROAS bid strategies. Without knowing your break-even number, you're guessing what to set. With it, you just add a 20-30% buffer above break-even and let the algorithm do its thing.
It Differs by Product — And That Changes Everything
Your premium product with 65% margin breaks even at 1.54x. Your entry-level product with 25% margin breaks even at 4.0x. If you're using the same ROAS target for both in your campaigns, you're either overspending on the low-margin product or under-investing in the high-margin one.
💡 Pro Tip
Calculate break-even ROAS for each product (or at least each product category) separately. Then structure your ad campaigns accordingly — allocate more budget to high-margin products where you have more room to be profitable.
Break-Even ROAS by Advertising Platform
Your break-even ROAS stays the same regardless of platform — it's based on your product economics, not where you advertise. But how you apply that number and what to expect differs significantly across platforms.

Google Ads
Where to find your ROAS: Go to Campaigns → Columns → Modify Columns → Conversions → look for "Conv. value/cost."
Google Ads, especially Google Shopping, tends to have the highest ROAS among major platforms because people searching on Google already have purchase intent. If someone types "buy organic face serum," they're much closer to buying than someone scrolling TikTok.
How to apply your break-even: When setting up a Target ROAS bid strategy, set it at least 20-30% above your break-even. If your break-even is 2.5x, set Target ROAS to 300-325%. This gives Google's algorithm some room to optimize while keeping you safely profitable.
Facebook / Meta Ads
Where to find your ROAS: Ads Manager → Columns → Customize → search for "Purchase ROAS."
Facebook typically delivers lower ROAS than Google Search because it's interruption-based advertising — you're showing ads to people who weren't actively looking to buy. That said, Facebook can scale much faster and reach audiences Google can't.
⚠️ Important Note About iOS 14.5+
Since Apple's privacy changes, Facebook's reported ROAS is often underreported by 15-30%. Keep this in mind when comparing your Facebook ROAS against your break-even number. Your actual ROAS is likely higher than what Ads Manager shows. Cross-reference with your Shopify or store analytics for a more accurate picture.
TikTok Ads
TikTok is still relatively new for direct response advertising, and the tracking isn't as mature as Google or Facebook. Expect more variability in reported ROAS.
My recommendation: add a 50% buffer above your break-even when evaluating TikTok campaigns. If your break-even is 2.5x, don't panic unless TikTok is consistently below 3.75x. There's often uncaptured value in the awareness and organic lift that TikTok drives.
Amazon PPC (ACOS)
Amazon doesn't use ROAS — they use ACOS (Advertising Cost of Sales), which is simply the inverse:
🔄 ROAS ↔ ACOS Conversion
ACOS = (1 ÷ ROAS) × 100
ROAS = (1 ÷ ACOS) × 100
Examples:
4.0x ROAS = 25% ACOS
2.5x ROAS = 40% ACOS
2.0x ROAS = 50% ACOS
ROAS = (1 ÷ ACOS) × 100
Examples:
4.0x ROAS = 25% ACOS
2.5x ROAS = 40% ACOS
2.0x ROAS = 50% ACOS
The beautiful thing about ACOS is that your break-even ACOS equals your profit margin percentage. If your margin (after Amazon fees, FBA, COGS) is 30%, your break-even ACOS is 30%. Simple as that.
Platform Comparison at a Glance
| Platform | Key Metric | Typical Ecommerce Range | Pro Tip |
|---|---|---|---|
| Google Search | ROAS | 4x – 8x | Set Target ROAS 20-30% above break-even |
| Google Shopping | ROAS | 5x – 10x | Separate campaigns by margin tier |
| Facebook/Meta | ROAS | 2x – 5x | Account for iOS under-reporting |
| TikTok | ROAS | 1.5x – 4x | Add 50% buffer above break-even |
| Amazon | ACOS | 15% – 35% | Break-even ACOS = profit margin % |
Industry ROAS Benchmarks (2026)
I want to be upfront about benchmarks — they're useful as directional guidance, but your break-even ROAS is the only number that actually matters for your business. A "below average" ROAS that's above your break-even is infinitely better than an "above average" ROAS that's below it.
That caveat aside, here's what we're typically seeing across industries in 2026:
| Industry | Average ROAS | Good ROAS | Excellent ROAS |
|---|---|---|---|
| Apparel & Fashion | 2.5x | 4x | 6x+ |
| Beauty & Cosmetics | 3x | 5x | 8x+ |
| Health & Wellness | 3x | 5x | 8x+ |
| Electronics | 2x | 3x | 5x+ |
| Home & Garden | 3x | 5x | 7x+ |
| Food & Beverage | 3x | 4x | 6x+ |
| Jewelry & Accessories | 2.5x | 4x | 7x+ |
| Sports & Outdoors | 2.5x | 4x | 6x+ |
| Pet Products | 3x | 5x | 7x+ |
| SaaS / Digital Products | 4x | 6x | 10x+ |
Notice how SaaS and digital products have higher ROAS? That's because they typically have near-zero marginal costs — the break-even ROAS is very low, so it's easier to hit higher multiples.
8 Practical Ways to Lower Your Break-Even ROAS
A lower break-even ROAS means it's easier to run profitable ads. It gives you more breathing room, lets you bid more aggressively, and opens up platforms that might not work at a higher break-even point.
Here's how to get there:
-
Negotiate Better Supplier Pricing
Every dollar you shave off your COGS directly improves your margin. Order in larger quantities, request volume discounts, or explore alternative suppliers. Even a 10% reduction in COGS can meaningfully change your break-even ROAS.
-
Increase Average Order Value
This is often the fastest lever. If customers buy 2 items instead of 1, your revenue doubles but your fixed costs per order (shipping, processing fixed fees, overhead allocation) barely move. Try bundles, "frequently bought together" widgets, free shipping thresholds, or tiered discounts like "Buy 2, Get 10% Off."
-
Test a Price Increase
Most brands undercharge. A 5-10% price increase often has minimal impact on conversion rates but a significant impact on margin. Test it — you might be surprised how little it affects sales volume.
-
Cut Shipping Costs
Negotiate rates with carriers as your volume grows. Use regional carriers for local deliveries. Consider flat-rate packaging. Or shift some or all shipping costs to the customer — test the impact carefully.
-
Reduce Your Return Rate
Returns are a profit killer most brands overlook. Better product photos, accurate descriptions, sizing guides, and video reviews can all reduce return rates. A drop from 12% to 6% return rate makes a real difference to your break-even ROAS.
-
Pull Back on Discounting
Running constant 20% off promotions trains customers to never pay full price. Consider value-adds instead — free gift with purchase, loyalty points, or exclusive access — that don't cut directly into your margin.
-
Optimize Payment Processing
Compare rates across Stripe, PayPal, Square, and others. Once your volume is high enough, negotiate custom rates. Saving even 0.3% on processing adds up significantly over thousands of transactions.
-
Focus Ad Spend on High-Margin Products
Not every product deserves ad budget. Identify your highest-margin products and concentrate your advertising there. Let low-margin products ride organic traffic, email marketing, or cross-sells from high-margin product purchases.
Mistakes That Quietly Cost Advertisers Thousands
Over the years, I've seen the same mistakes come up again and again. Here are the ones that actually cost real money:
Mistake #1: Forgetting "Hidden" Costs
The most common one by far. Business owners calculate their margin using only COGS and selling price. They forget payment processing fees (2-3% of every sale), shipping costs, returns, fulfillment fees, and software overhead. The result? They think their break-even is 2x when it's actually 3.2x. And they wonder why their "profitable" campaigns aren't showing up in the bank account.
✅ Fix This
Use a tool that accounts for all costs. Our Break-Even ROAS Calculator includes fields for every common cost factor — COGS, shipping, processing, platform fees, fulfillment, returns, discounts, and overhead.
Mistake #2: One ROAS Target for All Products
Your $80 premium product with 55% margin has a totally different break-even ROAS than your $15 accessory with 30% margin. Grouping them under one target means you're either overspending on the low-margin item or underspending on the high-margin one.
Mistake #3: Ignoring Attribution Gaps
The ROAS your ad platform reports isn't gospel. iOS privacy changes, ad blockers, multi-device journeys, and different attribution windows all create gaps. I've seen cases where Facebook reports a 2.5x ROAS but the true blended ROAS (tracked through the store backend) is actually 3.8x.
Always cross-reference platform ROAS with your actual store analytics. The truth is usually somewhere in between.
Mistake #4: Never Recalculating
Your supplier raises prices by 8%. Shipping carriers increase rates in January. You add $200/month in new software. All of these shift your break-even ROAS — but most brands set it once and never touch it again. Recalculate at least every quarter.
Mistake #5: Confusing Revenue With Profit
A 4x ROAS sounds impressive until you realize it means $4 in revenue per $1 in ads, not $4 in profit. If your margin is 25%, that $4 revenue is only $1 in gross profit — meaning you literally just broke even. The ROAS number alone doesn't tell you if you made money. Your break-even ROAS does.
Know Your Number. Stop Guessing.
Every decision you make about your ad campaigns should start with your break-even ROAS. Find yours right now — it takes less than a minute.
Use the Free CalculatorFrequently Asked Questions
Break-even ROAS is the minimum Return on Ad Spend your advertising campaign needs to achieve in order to cover all your costs — product cost, shipping, fees, overhead — without making a profit or a loss. If your break-even ROAS is 2.5x, you need at least $2.50 in revenue for every $1 you spend on ads just to break even. Anything above that number is profit. Anything below it means you're losing money.
The formula is straightforward: Break-Even ROAS = 1 ÷ Profit Margin. The key is calculating your profit margin correctly — include ALL costs like COGS, shipping, payment processing fees (usually 2.9% + $0.30), platform fees, fulfillment costs, and overhead. Then subtract total costs from your selling price, divide by selling price to get the margin, and divide 1 by that number. For a 40% margin: 1 ÷ 0.40 = 2.5x break-even ROAS.
There's no universal "good" ROAS — it depends entirely on your product margins. A 3x ROAS is amazing if your break-even is 1.8x (that's a 67% return above break-even). But the same 3x ROAS is actually losing you money if your break-even is 3.5x. As a general benchmark, most ecommerce brands aim for 3x-5x ROAS, but you should always measure against your specific break-even number first.
ROAS 400% is the same as 4x ROAS. It means for every $1 you spend on advertising, you generate $4 in revenue. Whether that's profitable depends on your margins. With a 30% profit margin, your break-even ROAS is 3.33x, so 400% (4x) ROAS would leave you with about $0.67 profit per dollar spent on ads after all costs.
Break-even ROAS is the minimum — the floor below which you lose money. Target ROAS is your goal — the level that gives you your desired profit. Think of break-even as "survival mode" and target as "growth mode." Your target should always be higher than break-even. A common approach is setting target ROAS at 1.5x to 2x your break-even number.
ACOS (Advertising Cost of Sales) is the metric Amazon uses — it's the inverse of ROAS. ACOS = (Ad Spend ÷ Revenue) × 100, while ROAS = Revenue ÷ Ad Spend. To convert between them: ROAS = 1 ÷ (ACOS/100). So a 25% ACOS equals a 4x ROAS, and a 40% ACOS equals a 2.5x ROAS. Your break-even ACOS is simply equal to your profit margin percentage.
You can lower your break-even ROAS by increasing your profit margin. The most effective strategies are: negotiating lower COGS with suppliers, increasing product prices (even small increases help), increasing average order value through bundles and upsells, reducing shipping costs, cutting down your return rate with better product content, and reducing how often and how deeply you discount.
If your ROAS is below break-even, you're losing money on every ad-driven sale. You have four options: optimize your campaigns to improve ROAS (better targeting, creatives, landing pages), reduce your costs to lower the break-even threshold, pause the unprofitable campaigns entirely, or — if you're confident about repeat purchases — consider that customer lifetime value might justify a short-term loss on the first order.
Definitely not. Every product has its own cost structure and margin, which means every product has a unique break-even ROAS. Your premium product with 60% margins might break even at 1.67x, while your budget product with 25% margins breaks even at 4x. Using one number across all products will lead to bad allocation decisions. Calculate separately for each product or product category.
At minimum, recalculate every quarter. But you should also recalculate whenever there's a significant change to your cost structure — supplier price increases, shipping rate changes, new software subscriptions, changes in your return rate, or if you adjust your pricing or discount strategy. Bookmarking a good calculator tool makes this quick and painless.
The Bottom Line
Here's what I want you to take away from all of this:
Break-even ROAS isn't some academic exercise or fancy metric to impress people in meetings. It's the single most practical number in your advertising toolkit. It tells you — with mathematical precision — whether a campaign is making you money or burning it.
Once you know your break-even ROAS, every advertising decision becomes clearer:
- Should I scale this campaign? Is it above break-even? Then yes.
- Should I pause this ad set? Is it consistently below break-even with enough data? Then probably yes.
- What Target ROAS should I set? Your break-even plus a profit buffer.
- Which products should I advertise? The ones with the lowest break-even ROAS (highest margins).
- Can I afford to run TikTok ads? Is the platform's typical ROAS above your break-even? Then worth testing.
It all starts with knowing your number.

Find Your Break-Even ROAS Right Now
It takes 30 seconds. No signup. No credit card. Just answers.
Calculate Now — It's FreeRelated Marketing Tools
Last updated: January 2025. Calculations and benchmarks reflect current market data. Bookmark our free calculator for quick access anytime.